Global
 Region


 Principles & vision


 Procurement
Global
Region
Principles & vision
Procurement
IRMay 08, 2003
|
Concluding Year of the Mid-Term Plan “Win21” Shows Significant Structural Improvements and Increased Results Despite Stressful Business Environment 1. FY 2002 Selected Financial Data
All Figures in Million of Yen, Except Per Share and Ratio Data
Forecast for FY2003 All Figures in Million of Yen, Except Per Share Data
2. Management Policies YASKAWA Electric Corporation, along with its subsidiaries and affiliated companies, has long held to the principle of “Advancement of Society and Contribution to Humanity through the Promotion of Business”. The supporting principles of “Developing State-of-Art Technology with a Mind for Quality” and “Responding to the Market according to Consumer Trends and Needs” have been joined by an “Investor Focused” view of value creation.
Investor values will be served by our determination to provide a stable dividend. As we endeavor to increase overall performance, we are focusing on increasing net profit for our shareholders. We will manage our company with both our own financial conditions and the economic environment in mind in order to achieve this.
YASKAWA also strives to develop its organizational structure such that even as we experience difficult economic conditions in the market place, we will be able to sustain profitability. To ensure the value for our shareholders, employees, and other stakeholders, our management performance is evaluated by 3 main
YASKAWA’s new mid-term business plan, Win21 Plus, focuses the company’s actions on sustaining profitability, while challenging the market place to achieve the original financial targets of the previous mid-term plan, Win21. Moreover, the company will focus on post-Mechatronics Shift structural reforms. (for more information on Win21 Plus, please return to our home page.)
YASKAWA is also working toward meeting external expectations better through its compliance program. The Company has added an outside director to its Board of Directors. Internally, the Company has set up an Ethics Committee whose job it is to ensure our Corporate Code of Conduct is being met in all our activities.
3. FY2002 Business Results 2002 saw the conclusion of YASKAWA’s mid-term plan “Win21” which began in 1999. The “four structural improvements” from the plan progressed significantly, strengthening the Company’s structural effectiveness. As price conditions worsened further this year, YASKAWA drastically cut material and operational costs. The resulting ordinary profit is 4.008 billion yen for the year. The Company also experienced an extraordinary loss, mainly as a result of taking a non-recurring accounting charge to correct the pension provision, further losses from securities revaluation as well as lower than expected profits from the sale of securities and the transfer of the government portion of the employees’ pension fund to the government. The result was a total net loss of 2.524 billion yen. (For more information on the Win21 results as well as the new mid-term business plan, Win21 Plus, please return to our home page.)
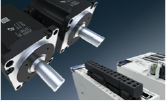
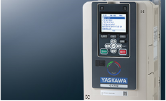
4. Results by Business Segment Motion Control Division The machine tool and ejection fabrication machine related markets stabilized during this year. This, along with the improving trend of the semiconductor and electronics related fields, both of which experienced extremely harsh conditions in the previous year, meant a better economic environment for AC servo sales. Also, the general-purpose AC Drive exports to Asia, which were focused on the Chinese market, did similarly well this year. As a result, the Motion Control Division as a whole increased its yearly revenue over the previous year by 5.8% to 86.314 billion yen. Operating profit was 305 million yen.
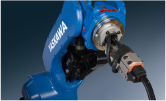
Robotics Automation Division Within the Robotics Automation Division’s automobile related market, which was mostly flat throughout the year, the Company made headway in increasing share in both the spot welding and painting robotics fields. The LCD equipment field also stabilized while semiconductor related clean and vacuum robots began recovery from the severe conditions of the previous year. As a result, revenues decreased slightly from the previous year by 1.3% to 67.094 billion yen. Operating profit was 2.985 billion yen.
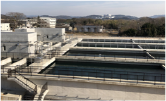
System Engineering Division The System Engineering Division’s main markets, steel plants and water utilities, saw little change from the previous year. However, new business in the sales of system solutions to equipment manufacturers increased dramatically. As a result, this year’s revenues topped the previous year by 5.7% at 39.509 billion yen. Operating profit was 1.259 billion yen.
Other Business Segments Information services continued to experience firm market conditions, however computer peripherals fell during this period. The segment’s revenues decreased from the previous year by 7.2% to 33.225 billion yen. Operational profit was 1.681 billion yen for the year.
5. Financial Conditions at the End of the FY 2002 Balance Sheet Highlights Current assets, in the area of notes and accounts receivable, trended upward along with the increase in revenues for the year. Current assets increased from the previous period by 10.499 billion yen to end at 158.46 billion yen for the year. On the other hand, Long-term assets, in the areas of tangible assets and investment in other assets, decreased by 7.417 billion yen from the previous period to 79.181 billion yen. The resulting total in assets was a 3.081 billion increase from the prior period to end at 237.641 billion yen. Current liabilities increased by 7.968 billion yen over the prior period. This figure includes a decrease of 3.3 billion yen in the area of short-term loans. However, as production increased, notes and accounts payable increased by 10.36 billion yen. The resulting total in liabilities was a 7.827 billion increase from the prior period to end at 202.784 billion yen. Decrease in retained earnings and the downward adjustment of securities negatively affected Equity. It ended 5.893 billion yen lower than the prior period totaling 30.631 billion yen.
Cash Flow Cash Flow from Operations increased to 8.444 billion yen, with depreciation and other non-cash related expenses totaling 13.9 billion yen. Cash Flow from Investments, as a result of income from the sale of securities and fixed assets of 5.970 billion yen, and expenditures on facilities and IT related items of 7.303 billion yen, decreased to negative 1.950 billion yen. Free cash flow increased to 6.494 billion yen. Long-term loans were increased to 7.8 billion yen while short-term loans decreased by 9.939 billion yen. Along with the re-payment of 4.706 billion yen for long-term loans, Cash Flow from Financing Activities decreased to negative 6.525 billion yen. Total cash balance for the period ended at 16.267 billion yen.
6. Outlook for the Next Fiscal Year Currently, YASKAWA believes FY 2003 will be considerably brighter than recent conditions. However, if the economy continues in a downward spiral, the Company will continue to experience harsh economic circumstances. Under our current assumptions regarding the economic situation during the next period, the Company expects the following business results. Note: All Figures are in Millions of Yen
Notes:
Warning
This release is made as of the date of writing. Any forward-looking statements are subject to change as a result of risks and uncertainties. The Company undertakes no obligation to update or revise the forward-looking statements, whether as a result of new information, future events, or otherwise. |
|||||||||||||||||||||||||||||||||||||||||||||||||||||||||||||||||||||||||||||||||||||||||
![]()

Copyright © 2003‐2026 YASKAWA ELECTRIC CORPORATION.